Scraping Grailed

Recently, I have been selling a large portion of my closet to Grailed, a community marketplace for men’s clothing centered on streetwear & designer.
As an avid user of this platform, I find it hard to easily compare prices of current listings versus sold listings of the same item, as you would have to scan through all listings in attempt to capture an overlying trend over time. Thus, it was hard to extrapolate best prices and listing features to sell your item quicker. Unfortunately, Grailed does not have a public API, so I though this would be a perfect opportunity to attempt to scrape relevant features from each listing to visualize fashion trends through data.
Disclaimer: The acceptable use policy for grailed.com does not officially allow for web scrapers or automated processes to gather their data. This project is purely for educational purposes to learn about underlying trends surrounding clothes.
Code can be found on my GitHub.
Selenium & BeautifulSoup:
There are many python packages suitable for web scraping:
BeautifulSoup(will be referred as bs4 for now on )ScrapyRequestsorLXMLSeleniumand a wrapper that makes it easier, Helium.
As a static scraper, Python often requires no more than the use of the Beautiful Soup by traversing the DOM (document object model) to reach its goal. However, static scraping ignores JavaScript and does not really capture other dynamic elements. Thus, automation through Selenium allows these dynamic elements to be clicked on, updating the static page so new information can be scraped.
There are many resources to get started with Selenium and bs4, but I will omit the majority of the set-up and include what was implemented in my code in my GitHub readme. However, I would like to detail some things before getting started:
-
Chrome Webdriver is used: different OS can be used with different browsers for automation through Selenium
-
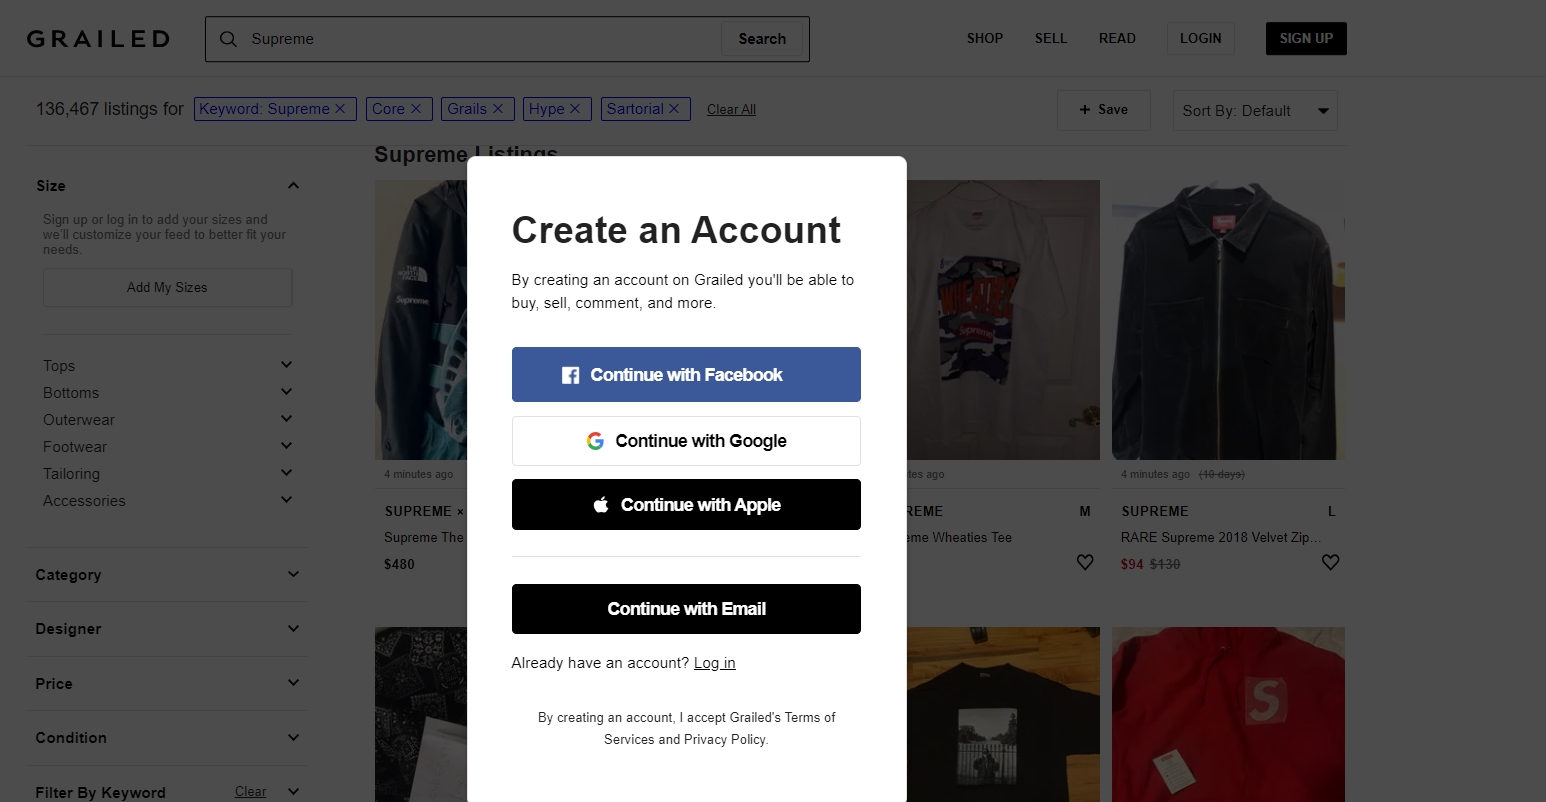
The first run creates cookies to ignore the log-in element: we use pickle to dump and get previous cookies so Selenium remembers our log-in information for future sessions. Each session on grailed will start at this create account screen that will prevent us from filtering listings, so to avoid this we must remember previous cookies.
And you can refer to the code here:
def first_run():
    ##Initialize Selenium
    options = Options()
    options.add_argument("user-data-dir=selenium")
    url = "https://www.grailed.com/users/sign_up"
    driver = webdriver.Chrome(WEBDRIVER_PATH, options=options)
    driver.get(url)
    time.sleep(2)

    #Login to account
    email = "PUT GRAILED EMAIL HERE"
    pw = "PUT GRAILED PWORD HERE"

    og_logxpath = "/html/body/div[3]/div[7]/div/div/div[2]/div/div/p[2]/a"
    login_xpath = "/html/body/div[3]/div[7]/div/div/div[2]/div/div/button[4]"
    driver.find_element_by_xpath(og_logxpath).click()
    time.sleep(1) #adds delay
    driver.find_element_by_xpath(login_xpath).click()
    time.sleep(1)

    email_xpath = "/html/body/div[3]/div[7]/div/div/div[2]/div/div/form/div[1]/input"
    pw_xpath = "/html/body/div[3]/div[7]/div/div/div[2]/div/div/form/div[2]/input"
    driver.find_element_by_xpath(email_xpath).send_keys(email)
    driver.find_element_by_xpath(pw_xpath).send_keys(pw)
    final_login_xpath = "/html/body/div[3]/div[7]/div/div/div[2]/div/div/form/button"
    driver.find_element_by_xpath(final_login_xpath).click()

    #uses pickle to save cookies
    #time.sleep(5)
    pickle.dump(driver.get_cookies() , open(COOKIES_PATH,"wb"))
- Used package
fake_useragent: sometimes, cloud security services like CloudFlare prevents web-scraping due to bot-like behavior. To prevent this, we need to use this package and cycle through different user-agents to not look like a bot when using Selenium.
from fake_useragent import UserAgent
ua = UserAgent()
userAgent = ua.random
#print(str(userAgent)) to see which agent is used
options.add_argument(f'user-agent={userAgent}')

url = "https://www.grailed.com/"
driver = webdriver.Chrome(WEBDRIVER_PATH, options=options)
driver.get(url)
-
Runs the following arguments (optimizes performance and ignores anything that is unnecessary):
options = webdriver.ChromeOptions()
options.add_argument("--start-maximized")
options.add_argument("--window-size=1920,1080")
options.add_argument("disable-infobars"); # disabling infobars
options.add_argument("--disable-extensions"); # disabling extensions
options.add_argument("--disable-gpu"); # applicable to windows os only
options.add_argument("--proxy-server='direct://'")
options.add_argument("--proxy-bypass-list=*")
options.add_argument('--ignore-certificate-errors')
options.add_argument('--allow-running-insecure-content')
options.add_argument("--disable-dev-shm-usage"); # overcome limited resource problems
options.add_argument('--headless') #browsers runs hidden locally
Data Collection Steps:
I want to thank Mike Liu for his initial help from his article to help me get started as his code acted as the foundation for mine. You can check out his Medium article which shows how he scraped Grailed. Unfortunately, some of the identifiers he used for some features are outdated as the website changed, so I updated them accordingly and added more features to be scraped in my version, as well as including filters for listings.
To highlight the scraping process after doing the first “set-up” run (I am omitting what each section of code in
sel.pydoes, there is some comments on some lines, but please email me for questions).
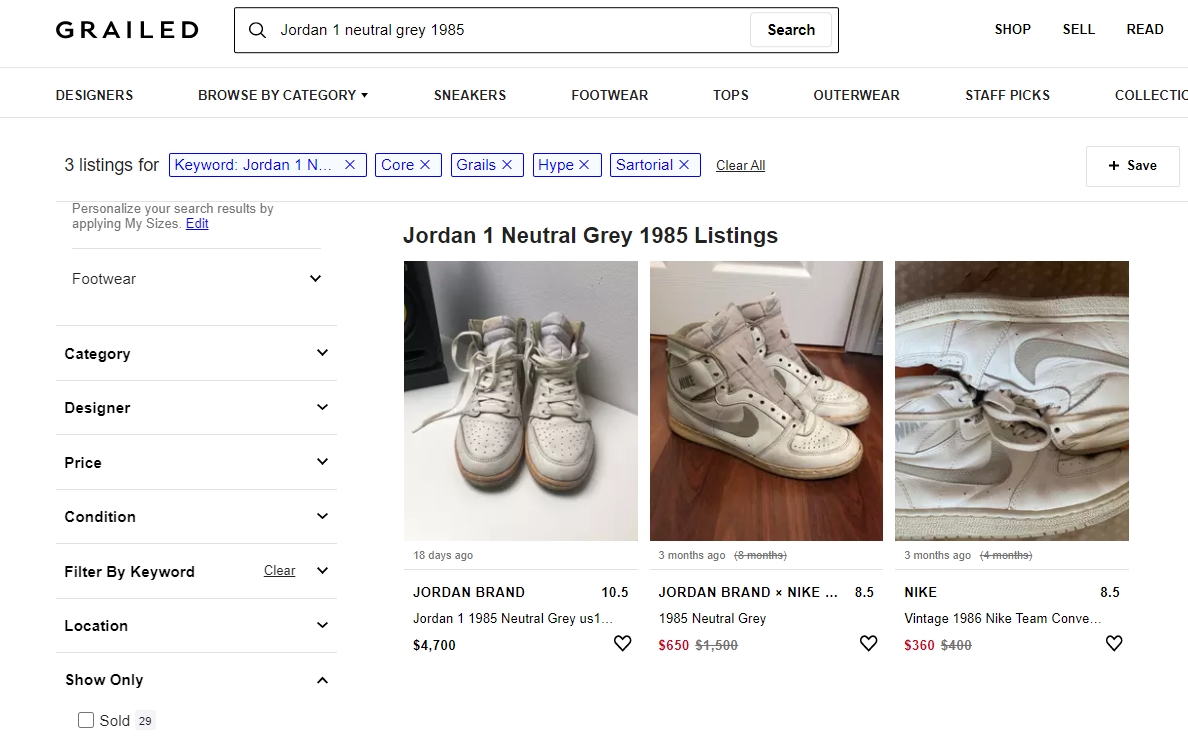
Step 1: Given user input (item name and amount to scrape), Selenium goes to the search page of the item.
Step 2: Apply the filters placed by the user, filter first if you want items that are sold only, unsold only, or include both. Then locate all containers (which is each listing) on the page using bs4. We will have to scroll to the amount of listings that the user wants to scrape (using a function that Mike created). There are also containers that are empty, so we have to also track this amount for future functions.
driver, display_amount = check_unlimited_scroll(display_amount, driver)
bs = BeautifulSoup(driver.page_source, 'html.parser')
containers = bs.find_all("div", class_="feed-item")
num_empty = len(bs.find_all("div", class_="feed-item empty-item"))
Step 3: For each container which has information for every listing, we can generalize to scrape the following attributes (Refer to the data dictionary from my GitHub for a definition of each feature). There are helper functions that do the scraping for us.
columns = ['pid', 'b_name', 'title', 'size', 'og_price', 'new_price', 'sold_price', 'is_sold', 'old_date', 'new_date', '%p_change', 'Link'])
Step 4: From step3, we also stored the website link to the listing as it contains a lot more features that we can extract. These features include: listing description, the amount of pictures in the listing, and user-based features (how much feedback seller received, their average feedback, amount of items sold, etc.) We can then also create user dataframes and append any new sellers if we truly wanted to (and update new information on previous sellers), however for the sake of time I have ignored this.
columns = ['uname', 'ship_cost', 'amt_sold', 'amt_feedback', 'amt_listings', 'desc', 'amt_likes', 'prf_link', 'feed_link', 'size_desc', 'loc', 'amt_pics'])
For future reference for myself, if you would like to track amount of images from a container, use the img tag:
numPics = len(bs.find_all("img", class_="PhotoGallery--Thumbnail"))
Step 5: Then, we merge both dataframes using variable Link as the common key.
Step 6: If including both sold or unsold items, merge both append dataframes together, and if necessary export the data to a .csv file so the user can use for future analysis.
Here are .gif’s that shows the process in action:

For unsold listings:
For sold listings: (note that a filter must be applied before cycling through each listing)
–
Prior Issues Handled:
Unfortunately, there were some problems I ran into during this project:
- Some listings had different amount of filters when trying to filter out
"Sold only", so it was hard to locate that element by PATH as it could be in different locations. I had to hard-code to include each edge-case:
check_sold = "/html/body/div[3]/div[7]/div/div/div[3]/div[1]/div/div[8]/div[2]/div/div/ul/li/label/div/input"
check_sold_2 = "/html/body/div[3]/div[7]/div/div/div[3]/div[1]/div/div[8]/div[2]/div/div/ul/li[2]/label/div/input"
check_sold_3 = "/html/body/div[3]/div[7]/div/div/div[3]/div[1]/div/div[8]/div[2]/div/div/ul/li[3]/label/div/input"
check_sold_4 = "/html/body/div[3]/div[7]/div/div/div[3]/div[1]/div/div[8]/div[2]/div/div/ul/li[4]/label/div/input"

    if len(driver.find_elements_by_xpath(check_sold)) > 0:
        driver.find_element_by_xpath(check_sold).click()
    elif len(driver.find_elements_by_xpath(check_sold_2)) > 0:
        driver.find_elements_by_xpath(check_sold_2)[0].click()
    elif len(driver.find_elements_by_xpath(check_sold_3)) > 0:
        driver.find_element_by_xpath(check_sold_3).click()
    else:
        driver.find_elements_by_xpath(check_sold_4).click()
- Dates were extracted as
'x time ago'. In order to normalize it to one date, I usedrelativedeltasfromdatetimeto normalize it based on today’s date:
"""
returns datetime with "X ... Ago" to relative date from a string
org_date: original date to be converted (str)
"""
def get_past_date(org_date):

    if org_date == "na" or org_date == "nan" or pd.isnull(org_date) or len(org_date.split()) == 1: #handles edge cases
        return "nan"

    fixed = org_date.replace("Sold", "").replace("almost", "").replace("over", "")
    splitted = fixed.split()

    TODAY = datetime.date.today()

    if len(splitted) == 1 and splitted[0].lower() == 'today':
        return str(TODAY.isoformat())
    elif len(splitted) == 1 and splitted[0].lower() == 'yesterday':
        date = TODAY - relativedelta(days=1)
        return str(date.isoformat())
    elif splitted[1].lower() in ['hour', 'hours', 'hr', 'hrs', 'h']:
        date = datetime.datetime.now() - relativedelta(hours=int(splitted[0]))
        return str(date.date().isoformat())
    elif splitted[1].lower() in ['minute', 'minutes', 'm', 'min']:
        date = datetime.datetime.now() - relativedelta(minutes=int(splitted[0]))
        return str(date.date().isoformat())
    elif splitted[1].lower() in ['day', 'days', 'd']:
        date = TODAY - relativedelta(days=int(splitted[0]))
        return str(date.isoformat())
    elif splitted[1].lower() in ['wk', 'wks', 'week', 'weeks', 'w']:
        date = TODAY - relativedelta(weeks=int(splitted[0]))
        return str(date.isoformat())
    elif splitted[1].lower() in ['mon', 'mons', 'month', 'months', 'm']:
        date = TODAY - relativedelta(months=int(splitted[0]))
        return str(date.isoformat())
    elif splitted[1].lower() in ['yrs', 'yr', 'years', 'year', 'y']:
        date = TODAY - relativedelta(years=int(splitted[0]))
        return str(date.isoformat())
    else:
        return "Wrong Argument format"
- I also needed to normalize a
final_pricegiven that there were three prices to choose from (the initial old price, the newest adjusted price, or the sold price). This was necessary for further visualizations.
"""
adds "final_price" variable, which does the following:
1. keeps org_price if listing not sold or updated price
2. keeps new_price if listing not sold
3. keeps sold_price if listing sold
"""
def fix_new_price(sold_prices, new_prices, is_sold, og_price):
    fixed = [x if (z == True) else y for (x,y,z) in zip(sold_prices, new_prices, is_sold) ]
    #now add final_price if only has original_price (not sold and price hasn't changed)
    final_price = [y if (pd.isnull(x) or pd.isna(x) or x == "NA") else x for (x,y) in zip(fixed, og_price)]
    return final_price
Implementing a Dashboard in Streamlit:
As described by the creators:
Streamlit turns data scripts into shareable web apps in minutes. All in Python. All for free. No front‑end experience required.
I wanted to finally implement Streamlit on a personal project, and thought this would be a perfect opportunity. I didn’t want the user to have to use a terminal to run the code locally, so I thought Streamlit Sharing would be a great way that doesn’t use Docker to upload my app online for others to use.
So here is a demo of what the dashboard when it’s run locally in bash through streamlit run "st-app.py"
Demo Videos (Two parts since skipped waiting):
Ignore the sound (was in a call with friends):
The dashboard is like 30% done as I need to include visualizations and more features, but the scraping portion of it is done as users can download the output as a .csv file. Expect more things soon!
You can download the code to run this application locally! Unfortunately, I was not able to deploy this app through Streamlit sharing as it requires a browser to be installed on their server, so Selenium can not be properly run server-side without a browser to use the webdriver.
Update: I just added interactive graphs with tooltips as seen below. You can adjust the x-domain to exclude outliers.
Unfortunately, the way I scraped sold listings are based on the most recent (will randomize in the future), so if you scraped few points the graph will be very biased to recent sold listings.

Future Applications:
Using different models for more accurate imputation, you can use the following:
- Use listing descriptions to capture sentiment for further analysis, can also apply
NLPto create the ‘perfect description’ for that item - Create a
binary classifierto figure out which features are the best to predict which listings will sell for a certain item (we have both sold and unsold listings for each item, can find an item with a lot of listings) Regression modelon price, predict which price is optimal to sell given the features of the item.
–
For more resources, I suggest looking through relevant articles on Grailed Scraping: